NSW's hidden cost of living, where rates tell you almost nothing
Every one of the 54 suburbs on Sydney's Northern Beaches pays the identical council rate: $1,766 a year. Living in the most expensive of them costs $4,907 more a year than the cheapest, and the rates notice looks exactly the same either way. That gap sits in commute and insurance, the two costs that never appear on a listing, and this data study joins them to council rates for the first time at the suburb level across Greater Sydney.
Council rates are usually the smallest of the four big recurring costs of running a NSW household, averaging just 15.1% of the total across Greater Sydney's 760 suburbs, and they are the single biggest of the four costs in only 2 suburbs. Commute alone averages 44.8%, nearly three times the share of rates. Suburbs with identical or near-identical council rates can differ by thousands of dollars a year once water, insurance and a modelled CBD commute are added, and suburbs with the highest rates in Sydney can end up cheaper overall than suburbs with much lower rates.
Key statistics
- Same-rate cost gap
- $4,907/yr (Northern Beaches)
- Rates is the biggest cost in
- 2 of 760 suburbs
- Avg. share: commute
- 44.8% of total
- Avg. share: council rates
- 15.1% of total
Methodology
Figures cover Greater Sydney's 760 suburbs across the 32 councils inside the Greater Sydney Commission boundary (Wollondilly excluded), for a house on a driving commute, the site default. Council rates are each council's 2026-27 average residential general rate, reported to the NSW Office of Local Government and uplifted by the IPART rate peg where applicable, not a minimum. Water and sewerage is largely 2025-26 pricing; rates are 2026-27; the two vintages are not perfectly aligned. Commute is a modelled annual cost of driving to the Sydney CBD, priced at the ATO's cents-per-kilometre rate with trip frequency tapering by distance, not measured household travel. Home insurance is AI-estimated from flood risk, fire risk and suburb type, disclosed as an estimate throughout; get an independent quote before relying on it for a real decision. Regional NSW is excluded from this analysis: distance to CBD is measured to Sydney specifically, so towns hundreds of kilometres away hit a flat modelling cap that has nothing to do with real cost variation and would distort a statewide comparison.
The short version
- Council rates average 15.1% of a Greater Sydney household's four big recurring costs. Commute averages 44.8%, insurance 24.4%, water 15.6%
- Rates is the single biggest of the four costs in exactly 2 of 760 Greater Sydney suburbs
- All 54 Northern Beaches suburbs pay the same council rate, $1,766, yet total running cost ranges from $8,116 to $13,023, a $4,907 gap
- Hunters Hill has the highest average council rate of any Sydney council, $2,446, yet its total running cost is 21% below the Sydney-wide median
- The gap cuts both ways: some outer suburbs with below-average rates carry some of the highest total costs in Greater Sydney, once commute and insurance are counted
Why rates get the headlines and everything else doesn't
NSW's 2026-27 rates cycle just wrapped. Seven councils, Ballina, Blacktown, Glen Innes Severn, Hawkesbury, Ku-ring-gai, North Sydney and Uralla, were approved to raise rates above IPART's peg, some by close to 30%. It made for a good story: an affluent harbourside council paying 23.3% more in a single year is the kind of number that gets picked up. It should. But while that was the number everyone was watching in July, the bigger gaps between NSW suburbs were sitting somewhere the rates notice never goes.
Council rates are the one cost that's public, uniform within a council area, and argued about in front of a regulator every year. IPART publishes the rate percentages. The ABS publishes broad cost-of-living indices. Nobody publishes council rates, water, insurance and commute joined together at the suburb level, because nobody else holds all four numbers for the same suburb at the same time. That join is the entire story here.
What the four costs actually add up to
SuburbCost totals four recurring annual costs for every Greater Sydney suburb: council rates, water and sewerage, home insurance, and a modelled cost of commuting to the CBD by car. Across all 760 suburbs in the 32 councils that make up Greater Sydney, council rates average 15.1% of that total. Water is almost identical, 15.6%. Insurance runs closer to a quarter, 24.4%. Commute alone accounts for 44.8%, close to three times the share of rates.
Rates is the single biggest of the four costs in exactly two of the 760 suburbs we checked. Both of those two, as it happens, are suburbs where rates only wins by default, because their commute is unusually small, not because their rates bill is unusually large.
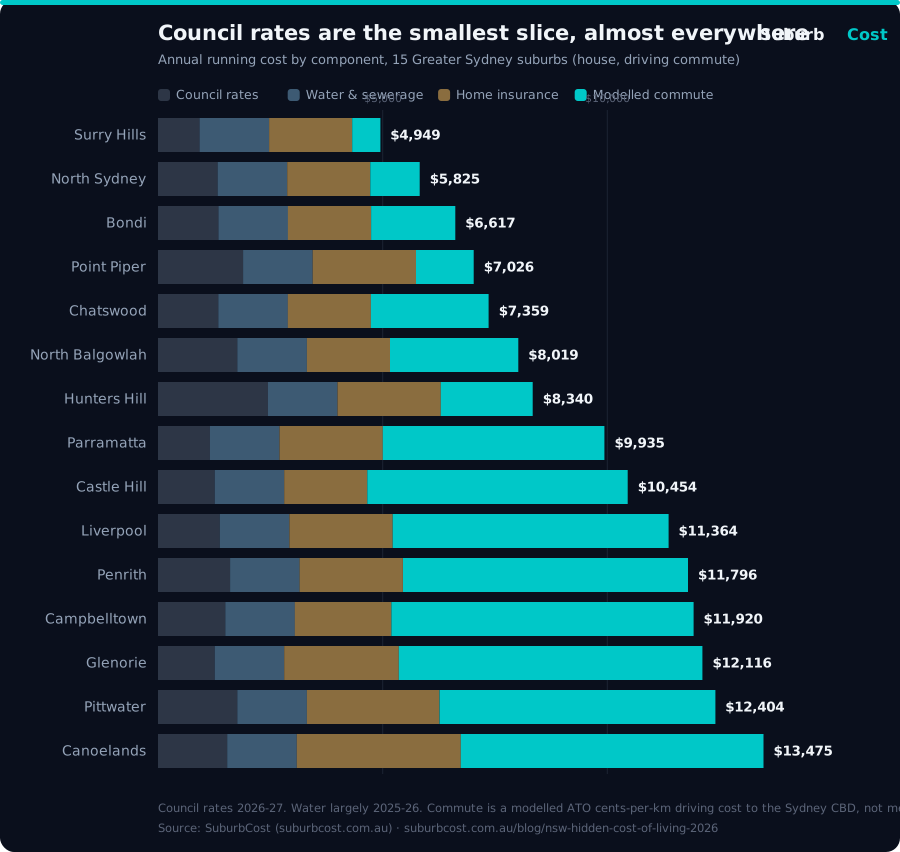
Council rates, water, insurance and modelled commute, 15 representative Greater Sydney suburbs (2026-27 rates, 2025-26 water). Full chart + underlying data →
Same council rate, $4,907 apart in real cost
The Northern Beaches is the cleanest version of this pattern anywhere in Greater Sydney, because it removes rates as a variable entirely. Every one of its 54 suburbs pays the same council rate: $1,766. There is no cheaper or more expensive rates bill anywhere on the peninsula. And yet total annual running cost across those 54 suburbs ranges from $8,116 in North Balgowlah, close to Manly with a short commute and low flood and fire risk, to $13,023 in Pittwater, 27.9km out with a modelled commute of $6,140 and elevated flood-risk insurance. A gap of $4,907 a year, on an identical rates bill.
Avalon Beach and Bilgola Beach land close behind Pittwater, both above $11,800, both for the same reason: distance and risk, not rates. If you compared two Northern Beaches suburbs on their council rate alone, you would learn nothing about which one actually costs more to live in, because the answer would be the same for both.
The suburb with Sydney's highest rate is 21% cheaper than the median
Hunters Hill has the highest average council rate of any council area in Greater Sydney, $2,446, comfortably ahead of Ku-ring-gai ($2,189) and Woollahra ($1,894). On rates alone, it reads as one of the most expensive places in Sydney to own a home. Its total annual running cost is $8,340, which sits 21% below the Greater Sydney median of $10,618. The same rate that would suggest Hunters Hill is expensive comes with a 6.6km commute, and that's what actually decides the number.
The pattern repeats across the harbourside councils generally. Woollahra, Point Piper, Bellevue Hill, Double Bay, Vaucluse, Roseville and Lindfield all carry above-average council rates, and all rank in the cheapest third of Greater Sydney on total running cost, because none of them ask their residents to drive far. Proximity beats the rates notice every time.
| Suburb | Council rate | Total running cost | vs Sydney median ($10,618) |
|---|---|---|---|
| Hunters Hill | $2,446 | $8,410 | 21% below |
| Point Piper | $1,894 | $7,070 | 34% below |
| Woollahra | $1,894 | $6,557 | 39% below |
| Chatswood | $1,341 | $7,448 | 31% below |
Source: SuburbCost, house/driving basis. See data sources for the full methodology.
It cuts both ways
Glenorie, in The Hills, pays a council rate of $1,261, $236 below the Sydney-wide median. On rates alone, it looks like one of the more affordable options in the area. Its total running cost is $12,116, inside the most expensive 11% of Greater Sydney's 760 suburbs, once a 39.5km commute and elevated bushfire-risk insurance are added. Compare council rates between Glenorie and Chatswood and you'd conclude Glenorie is the cheaper suburb. On the number that actually lands in a household budget each year, it is $4,757 more expensive.
Kenthurst, also in The Hills, follows the same pattern: a $1,261 rate, a 35.2km commute, a $12,020 total. Neither suburb is being charged unfairly. They're simply a long way from the city, and the rates notice is the one line that doesn't say so.
Insurance moves the number less than commute does, but it isn't nothing
Across Greater Sydney, SuburbCost's estimated home insurance ranges from $1,850 to $3,650 depending on flood risk, fire risk and suburb type, an AI estimate, not a quote, disclosed as such on every suburb page. It doesn't spare the best-known addresses. Woolloomooloo, The Rocks, Barangaroo, Pyrmont, Potts Point and Kirribilli all carry the same elevated $2,950 flood-risk premium despite being scattered across different suburbs and different councils. It just doesn't move their total much, because none of them have a commute worth mentioning.
Where insurance does matter is in combination. Canoelands, the most expensive suburb in this dataset at $13,705 a year, carries both a near-ceiling insurance estimate ($3,650, high flood and fire risk) and one of the largest modelled commutes (42.3km, $6,736). Neither cost alone would put it at the top. Together, they do.
The number worth checking is seventeen years of a rate rise, every year
Here's the comparison worth sitting with. Move from Bondi to Liverpool and the modelled annual commute rises from $1,875 to $6,140, a difference of $4,265 a year. That's more than seventeen times North Sydney's $251 rate increase, the single largest dollar rise any NSW council applied for 2026-27, the number that made every rates story in July. Nobody writes a headline about a $4,265 commute gap. It doesn't happen once a year on a council notice. It's simply there, every year, for as long as someone lives in the suburb.
Parramatta splits the difference: 19.2km out, a modelled commute of $4,931, still $3,056 more than Bondi's, still twelve times North Sydney's rate rise. The distance from the CBD is doing more to a household's annual cost than any council decision on this page.
What this means if you're choosing between two suburbs
None of this means council rates don't matter. Over a decade they add up, and the councils approved for above-peg rises are genuinely paying more than their neighbours. But rates are also the one cost that's identical for every household in a council area, printed on a notice, checked against a peg, argued about in public.
Commute and insurance are not. They vary by thousands of dollars a year between suburbs a few kilometres apart, sometimes inside the very same council, on the very same rates notice, and nothing forces anyone to compare them before signing a contract. If you're weighing up two NSW suburbs, the number worth checking first isn't the one the council sends you each July. It's the one nobody sends you at all.
Hunters Hill carries the highest residential rate in New South Wales, see how it compares →
Frequently asked questions
Why do council rates get so much attention if they're not the biggest cost?
Council rates are the one cost that's public, uniform and argued about each year. Every ratepayer in a council area is charged the same rate, IPART sets a peg, and a council either stays under it or applies for a special variation that becomes news. Water, insurance and commute vary suburb by suburb within the same council and never generate an equivalent annual news cycle, even though across Greater Sydney they average nearly 85% of the total.
What is the hidden cost of living in NSW, beyond council rates?
Across 760 Greater Sydney suburbs, the average recurring annual cost for a house on a driving commute splits into council rates (15.1% of the total on average), water and sewerage (15.6%), home insurance (24.4%) and a modelled commute to the CBD (44.8%). Commute and insurance, not rates, are what usually separate an expensive suburb from a cheap one.
How much does commuting really add to the cost of living in a NSW suburb?
It varies enormously by distance. A Bondi household's modelled annual commute cost is about $1,875; the same modelled commute from Liverpool is about $6,140, a difference of $4,265 a year, more than 17 times North Sydney's $251 rate rise, the largest single-council dollar increase applied anywhere in NSW for 2026-27. Commute is calculated using the ATO cents-per-kilometre rate, not measured household travel.
Are NSW council rates a reliable guide to how expensive a suburb is to live in?
No. Hunters Hill has the highest average council rate of any council in Greater Sydney, $2,446, yet its total annual running cost sits 21% below the Sydney-wide median because it is close to the CBD with a short modelled commute. Conversely, some outer suburbs with below-average rates rank among the most expensive overall once commute and insurance are added.
Check the real cost of your NSW suburb
SuburbCost shows council rates, water, insurance and commute side by side for every Greater Sydney suburb, not just the rates line. Compare any two suburbs and see which cost is actually driving the difference.
Compare suburb costs →Data sources
Council rates: NSW Office of Local Government average residential general rate, 2026-27, uplifted by IPART's published rate peg and approved special rate variations where applicable, cross-checked against SuburbCost's NSW council rates 2026-27 study. Water and sewerage: Sydney Water and other Greater Sydney retailers, largely 2025-26 pricing. Commute: ATO cents-per-kilometre rate applied to modelled road distance to the Sydney CBD, with trip frequency tapering by distance; see the Greater Sydney Suburb Running Cost Index for the full formula. Home insurance: AI-estimated from flood risk, fire risk and suburb type, disclosed as an estimate. Coverage: 760 suburbs across the 32 councils inside the Greater Sydney Commission boundary, Wollondilly excluded. Figures exclude property purchase price or value in every instance. Data period: council rates 2026-27, water and commute 2025-26.
Cite this data
SuburbCost data is free to cite with attribution. Please link to this page as the source.
Journalists: the underlying suburb-level data behind every figure in this piece is available as CSV in the press kit, along with a standalone version of the chart above.